






Bitcoin briefly moved above $85,000 on September 21, reaching its highest level since January. Ethereum was around $2,717, XRP had climbed to approximately $1.49, and Solana was trading near $115.75 in a September 21 market snapshot from The Block. ETH was up about 5.6% over 24 hours, XRP roughly 7.8%, and SOL approximately 7.2%.
The broader cryptocurrency market has strengthened as well. CoinGecko’s global market dashboard showed total crypto capitalization around $2.9 trillion, up approximately 2.95% over 24 hours, with Bitcoin representing about 57.03% of total market value.
The recovery is notable because it comes only days after the Federal Reserve raised its benchmark interest-rate range by 25 basis points to 3.75%-4.00% on September 16, 2026. The Fed said economic activity remained solid but inflation was still elevated, making the decision part of its effort to return inflation toward the 2% objective.
Normally, tighter monetary policy can pressure speculative assets. Higher rates increase the return available from cash and fixed-income markets while tightening overall financial conditions.
Yet cryptocurrencies have moved strongly higher after the initial post-Fed weakness.
The explanation appears to involve several factors rather than one single catalyst: Bitcoin ETF inflows returned, enormous leveraged short positions were liquidated, oil and Treasury yields eased, traditional equity markets improved, and recent U.S. regulatory developments provided a more constructive backdrop for blockchain-based financial infrastructure.
The key question for IBTC247 readers is whether this is the beginning of a more durable recovery or simply a powerful short-term rebound following a heavily leveraged selloff.

Crypto Market Today: BTC, ETH, XRP and SOL Snapshot
The September 21 rally has been broad rather than limited to Bitcoin.
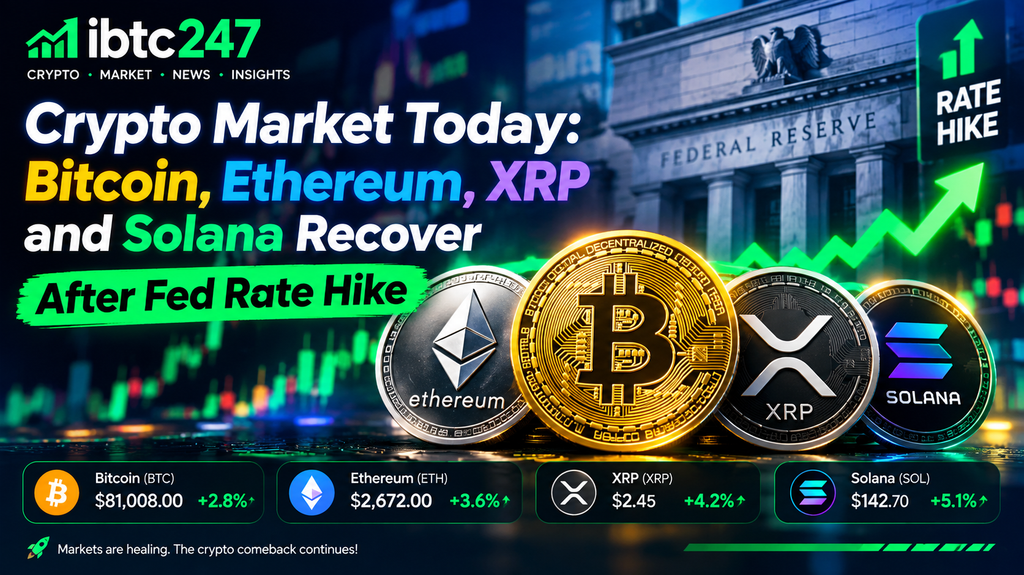
| Asset | September 21 market snapshot | Approx. 24h move |
|---|---|---|
| Bitcoin | Above $85,000 intraday | More than +5% |
| Ethereum | ~$2,717 | +5.6% |
| XRP | ~$1.49 | +7.8% |
| Solana | ~$115.75 | +7.2% |
The figures are from The Block’s September 21 report and represent a particular market snapshot rather than fixed daily closing prices.
CoinGecko’s continuously updated pages have shown somewhat different quotes depending on crawl time. For example, its Bitcoin snapshot showed BTC around $83,492, while Ethereum was around $2,683.94 and Solana around $113.85. These differences are normal in fast-moving 24/7 crypto markets and reinforce the importance of timestamping price data.
What matters for market analysis is the direction: all four major assets have recovered significantly from the weakness surrounding the Fed decision.
What Did the Federal Reserve Do?
On September 16, 2026, the Federal Open Market Committee unanimously raised the federal-funds target range by a quarter percentage point to 3.75%-4.00%.
The Fed said the U.S. economy was expanding at a solid pace, domestic spending remained resilient and capital investment was strong. However, policymakers also said inflation remained elevated.
The accompanying implementation note increased the interest rate paid on reserve balances to 3.90% and raised the primary credit rate to 4.00%, effective September 17.
This was significant because the move represented renewed monetary tightening after previous rate reductions.
Crypto initially struggled around the decision.
Bitcoin’s CoinGecko historical data shows a close around $76,147 on September 16, only slightly above its September 15 close around $75,590. By September 18, however, Bitcoin had recovered to approximately $80,874.
That rapid reversal set the stage for the September 21 breakout.
Why Can a Fed Rate Hike Hurt Crypto?
Interest rates affect the relative attractiveness of different assets.
When central-bank rates rise, yields on government securities, money-market funds and other lower-risk instruments can also increase.
Investors therefore receive more compensation for holding safer assets.
Bitcoin, Ethereum, XRP and Solana do not provide guaranteed returns. Their prices depend primarily on supply, demand, liquidity and investor expectations.
Higher rates can consequently make speculative assets less attractive.
Tighter policy can also strengthen the dollar, increase financing costs, reduce market liquidity and pressure growth stocks—all conditions that can spill into cryptocurrencies.
That is why a rally immediately following a rate increase deserves closer analysis.
The market is effectively showing that other factors are currently strong enough to offset at least part of the monetary-policy pressure.
Why Is the Crypto Market Recovering Anyway?
The latest recovery appears to be driven by a combination of short liquidations, returning ETF demand, falling oil prices, lower bond yields and improved risk appetite.
No single factor fully explains the move.
That distinction matters because different catalysts have different levels of durability.
ETF demand can persist for weeks.
Short liquidations may last only hours.
Macroeconomic sentiment can reverse on one inflation report.
Regulatory developments can affect longer-term institutional expectations.
Understanding which components continue will help determine whether the rally survives.
Massive Crypto Short Liquidations Accelerated the Rally
Leverage appears to have played a particularly important role.
CoinGlass data cited by The Block showed more than $750 million of cryptocurrency positions liquidated during a 24-hour period, including approximately $648.3 million in short positions.
Bitcoin accounted for about $360.7 million of total liquidations.
A short position profits when price falls.
When an asset unexpectedly rises, highly leveraged shorts can be automatically liquidated.
Those positions generally need to be bought back, creating additional demand.
That forced buying can push price higher, causing additional short positions to fail and creating a chain reaction known as a short squeeze.
This helps explain why the September 21 recovery moved so quickly.
However, traders should recognize the limitation.
Short covering can accelerate an existing rally, but it does not necessarily create sustainable long-term demand.
Once the vulnerable shorts have been removed, the market needs real spot buyers to maintain higher prices.
Falling Oil Prices Are Helping Risk Sentiment
The macro environment also improved during the September 21 session.
The Block reported Brent crude down around 1.5%, while improving oil-supply conditions and diplomatic hopes helped reduce some recent inflation concerns. Asian technology stocks, European equities and U.S. equity futures were also advancing.
Investopedia separately reported crude oil moving below $98 while the U.S. 10-year Treasury yield retreated to approximately 4.95%.
Falling oil can matter for crypto indirectly.
Energy prices are an important component of inflation expectations.
If oil continues falling, investors may become less concerned that the Federal Reserve needs to tighten monetary policy aggressively.
Lower bond yields can also support valuations for risk-sensitive assets.
That does not mean oil prices determine Bitcoin.
It means the broader macro environment became somewhat more supportive at the same time the cryptocurrency market was already recovering.
Fed Risk Has Not Disappeared
Despite the rally, interest-rate risk remains significant.
The Block reported that markets were still assigning roughly a 56% probability of another increase in October, according to a Capital.com market note, while the U.S. two-year Treasury yield was around 4.75%.
That estimate can change rapidly.
But it illustrates an important point: crypto is not rallying because monetary policy has suddenly become loose.
The rally is occurring while policy remains restrictive.
If inflation data strengthens or policymakers signal additional tightening, interest-rate expectations could become a headwind again.
Bitcoin Leads the Crypto Market Recovery
Bitcoin remains the most important asset in the current rally.
BTC briefly surpassed $85,000 on September 21, its highest level since January, after trading near $75,000 only six days earlier.
CoinGecko historical data shows the sequence clearly:
September 15: approximately $75,590
September 16: approximately $76,147
September 17: approximately $76,371
September 18: approximately $80,874
September 19: approximately $81,236
September 20: approximately $81,169.
The September 21 push above $85,000 therefore represents a substantial recovery from the mid-month low.
Why $85K Matters for Bitcoin
Recent Bitcoin analysis has repeatedly identified the low-to-mid $80,000 region as an important area of supply.
BTC moving through $83,000 and then $85,000 indicates that buyers have been able to absorb at least part of that resistance.
However, a temporary intraday move is not the same as permanently establishing support.
For the recovery to strengthen, Bitcoin needs to continue holding the $80,000-$83,000 region during pullbacks.
A sustained move above the broader $85,000-$86,000 area would provide another technical improvement.
Bitcoin ETF Inflows Have Returned
Institutional demand through U.S. spot Bitcoin ETFs has also improved.
Farside Investors recorded approximately:
September 15: -$450.4 million
September 16: -$295.9 million
September 17: +$159.5 million
September 18: +$324.6 million.
This sequence is important.
Almost $750 million left the funds across September 15 and 16.
Then flows reversed.
The following two trading sessions generated approximately $484 million of combined net inflows.
That return of institutional demand coincided closely with Bitcoin’s recovery above $80,000.
It does not prove ETF flows caused the entire rally, but the timing suggests regulated investment products have again become a meaningful source of demand.
Why Bitcoin ETF Flows Matter for the Entire Crypto Market
Bitcoin accounts for around 57% of total cryptocurrency market capitalization, according to CoinGecko.
As a result, strong Bitcoin demand can influence sentiment far beyond BTC itself.
When institutional capital enters Bitcoin and BTC begins breaking resistance, traders often become more willing to hold Ethereum and higher-beta altcoins.
That appears to be happening now.
XRP and Solana both posted larger percentage gains than Bitcoin in The Block’s September 21 snapshot.
This is an important sign of improving market breadth.
But it can also mean risk appetite is increasing rapidly.
Ethereum Price Today: ETH Recovers Toward $2,700
Ethereum has staged its own substantial recovery.
CoinGecko data shows ETH closing near $2,415.96 on September 16, followed by $2,446.14 on September 17 and $2,611.56 on September 18.
By September 21, The Block showed Ethereum around $2,717, up approximately 5.6% over the preceding day.
ETH has therefore moved from the low-$2,400 region toward $2,700 in less than a week.
Ethereum’s Next Technical Question
The $2,700-$2,800 region is now important.
Ethereum has already pushed through several levels that previously limited the recovery.
If buyers can maintain the current structure, $2,800 becomes the next obvious psychological barrier.
If ETH eventually establishes support above $2,800, traders may begin focusing more heavily on $3,000.
But a rejection around current levels could return Ethereum toward $2,600.
Ethereum ETF Flows Are Less Convincing Than Bitcoin’s
Ethereum’s institutional-flow picture is more mixed.
Farside reported:
September 14: +$121.1 million
September 15: -$142.0 million
September 16: -$224.1 million
September 17: -$39.3 million
September 18: +$29.4 million.
The return to positive flows on September 18 is constructive.
However, the $29.4 million inflow is small compared with the withdrawals recorded during the preceding three sessions.
Ethereum therefore needs additional positive ETF days before the market can describe institutional demand as clearly reaccelerating.
This creates an important difference between BTC and ETH.
Bitcoin currently has stronger recent ETF-flow confirmation.
Ethereum’s price momentum is strong, but ETF demand remains less consistent.
Ethereum DeFi Activity Provides Fundamental Support
Ethereum’s underlying ecosystem remains substantial.
DefiLlama’s latest chains dashboard showed Ethereum with approximately $53.1 billion in DeFi total value locked, about $147 billion in stablecoins, roughly $1.64 billion in 24-hour decentralized-exchange volume, and around 493,000 active addresses.
These statistics do not predict ETH’s price.
However, they show that Ethereum continues to support a large amount of financial activity.
That matters because ETH is more than a speculative token.
It is used within a major smart-contract and DeFi ecosystem.
Glamsterdam Adds Another Ethereum Catalyst
Ethereum also has a major protocol upgrade ahead.
Ethereum.org says Glamsterdam is currently being tested on devnets and is expected on mainnet during Q4 2026, although the final date has not been confirmed.
The next milestone is the Sepolia fork on October 6, 2026.
Glamsterdam is designed to improve Ethereum’s layer-1 scalability by changing how transactions and database growth are managed.
The upgrade does not guarantee a higher ETH price.
Still, successful development can strengthen longer-term confidence in Ethereum’s ability to scale.
XRP Price Today: XRP Outperforms During the Recovery
XRP has been one of the stronger large-cap assets during the September 21 rally.
The Block reported XRP around $1.49, up approximately 7.8% in 24 hours.
CoinGecko historical data shows XRP around $1.30 on September 16 and September 17, before recovering to approximately $1.40 on September 18.
That means XRP’s current move represents a notable recovery from the immediate post-Fed period.
Is XRP’s Rally Driven by a Specific Catalyst?
There is currently stronger evidence for a broad market recovery than for one dominant XRP-specific catalyst.
A current CoinMarketCap analysis described XRP’s outperformance as primarily consistent with improving broad-market conditions and capital rotation toward altcoins rather than one clear project-specific event.
That interpretation is important.
When an asset rises because the whole market is becoming more risk-seeking, its next move may remain heavily dependent on Bitcoin and overall liquidity.
XRP traders should therefore watch whether its relative strength continues if Bitcoin enters consolidation.
What Levels Matter for XRP?
The market has already moved above the $1.40 area that defined much of the latest recovery.
The next question is whether XRP can maintain the breakout after a strong one-day move.
If price remains above the previous $1.40 region during a pullback, that would suggest the rally has developed stronger support.
If XRP rapidly loses the level, some of the latest move may prove to have been short-term momentum rather than durable accumulation.
Because XRP gained faster than BTC in the latest session, it may also experience larger percentage swings if market sentiment changes.
Solana Price Today: SOL Extends Its September Recovery
Solana is another major outperformer.
The Block showed SOL around $115.75, up approximately 7.2% over 24 hours.
CoinGecko’s current page showed Solana around $113.85, illustrating the difference between market snapshots, with a 24-hour range between approximately $107.74 and $113.95 in that crawl.
Historical data shows SOL closed around:
September 15: $96.87
September 16: $98.54
September 17: $101.57
September 18: $112.70
September 19: $111.02
September 20: $111.15.
That makes Solana’s rebound one of the strongest among the four major assets discussed here.
Solana’s On-Chain Activity Remains Strong
Solana also continues to show substantial blockchain activity.
DefiLlama’s current dashboard reported approximately $6.27 billion in Solana DeFi TVL, roughly $15.6 billion in stablecoins, about $3.54 billion in 24-hour decentralized-exchange volume, and approximately 2.62 million active addresses.
Notably, the reported daily DEX volume was substantially higher than Ethereum’s in the same snapshot.
This highlights Solana’s strength in high-frequency trading and consumer-facing on-chain activity.
It does not necessarily mean Solana is fundamentally more valuable than Ethereum; the two networks have different architectures, ecosystems and capital structures.
But active network usage provides a fundamental backdrop to SOL’s price recovery.
Why Solana Often Moves Faster Than Bitcoin
Solana has a much smaller market capitalization than Bitcoin.
Smaller assets can move more aggressively because less capital is required to create a meaningful percentage price change.
They can therefore outperform during bullish periods.
The same characteristic creates downside risk.
If Bitcoin loses support, SOL may experience a larger percentage decline.
That higher beta is one reason Solana gained more than Bitcoin during the latest rebound.
Is This the Beginning of an Altcoin Rally?
The fact that ETH, XRP and SOL all outperformed Bitcoin in The Block’s September 21 snapshot indicates improving market breadth.
However, one day of altcoin strength is not enough to establish a full “altseason.”
Bitcoin still holds roughly 57% market dominance.
A more sustained altcoin rotation would normally involve:
Bitcoin remaining stable rather than collapsing.
Ethereum gaining relative strength against BTC.
Capital continuing to enter large-cap altcoins.
Broader market volume expanding.
Bitcoin dominance declining over a longer period.
DeFi and stablecoin liquidity remaining healthy.
At the moment, the evidence points toward broader participation in the rebound, not definitive confirmation of a long-duration altcoin cycle.
Regulatory Developments Are Also Supporting Sentiment
The U.S. regulatory picture remains complicated, but there has been at least one significant development.
On September 17, 2026, the Securities and Exchange Commission announced a temporary Innovation Exemption allowing qualifying Tokenized Securities Venues to facilitate limited trading of tokenized U.S.-listed stocks using permissioned automated market makers and liquidity pools.
The exemption includes several conditions.
Tokenized stocks must provide equivalent shareholder rights, venues must follow trading-halt rules, smart contracts must be auditable and public, and the relief is temporary.
This regulation does not directly change the Bitcoin, Ethereum, XRP or Solana protocols.
But it signals greater willingness by U.S. regulators to permit blockchain-based financial infrastructure under defined conditions.
That can affect broader digital-asset sentiment.
Why Tokenization Regulation Matters to Crypto
Institutional adoption increasingly extends beyond simply buying cryptocurrency.
Banks, exchanges and asset managers are exploring blockchain for settlement, tokenized securities, stablecoins and other financial infrastructure.
The SEC’s September 17 exemption is therefore relevant because it connects traditional securities markets with public blockchain technology.
It could benefit the broader perception of networks capable of hosting tokenized assets.
However, investors should avoid treating every positive tokenization announcement as a direct reason for cryptocurrency prices to rise.
Regulatory infrastructure and token valuations remain separate issues.
Is the Current Rally Fundamentally Strong?
The evidence is mixed but improving.
Bullish evidence
Bitcoin ETF inflows returned after major withdrawals.
BTC broke through $80,000 and briefly surpassed $85,000.
Ethereum, XRP and Solana are participating strongly.
The total crypto market has recovered toward roughly $2.9 trillion.
Ethereum and Solana continue to show meaningful on-chain activity.
Lower oil prices and softer bond yields improved broader risk appetite.
Recent SEC action offered a constructive tokenization signal.
Cautionary evidence
The Fed has just raised rates.
Markets still see a meaningful possibility of additional tightening.
Ethereum ETF flows remain inconsistent.
A major portion of the latest upward move was amplified by short liquidations.
Bitcoin is approaching an important resistance region.
Altcoins have moved quickly and may be vulnerable to profit-taking.
The result is a market that looks significantly healthier than it did several days ago, but is not free of risk.
Bitcoin Support and Resistance After the Rally
Bitcoin’s most important immediate support area is now around $80,000-$83,000.
BTC spent several sessions around $81,000 before the September 21 acceleration.
If the market returns to this zone and buyers defend it, the recovery structure becomes stronger.
The immediate resistance region is roughly $85,000-$86,000.
Bitcoin has already traded into that zone.
The next question is whether it can remain there rather than simply produce an intraday spike.
A sustained break would likely improve sentiment across ETH, XRP and SOL as well.
Ethereum Support and Resistance
Ethereum’s recent structure places the first major support near $2,600.
ETH moved above that level on September 18 after spending the preceding sessions around $2,400-$2,450.
Immediate resistance lies near $2,700-$2,800.
ETH has already traded around $2,717 in the latest rally.
A strong move above $2,800 would bring the psychological $3,000 threshold closer.
A loss of $2,600 would suggest Ethereum needs more consolidation.
XRP Support and Resistance
XRP’s latest recovery moved from approximately $1.30 after the Fed decision to nearly $1.50 during the September 21 rally.
The previous $1.40 area may now become an important support test.
If XRP stays above it, the latest breakout becomes more convincing.
A rapid move back beneath the zone would indicate weaker follow-through.
Because the latest rally has been relatively steep, traders should also expect wider intraday volatility.
Solana Support and Resistance
SOL moved from below $100 around September 15-16 to more than $115 during the latest recovery.
The $110 area is therefore becoming an important short-term pivot.
If Solana can remain above that region, the structure remains constructive.
A return below $105-$110 would suggest momentum is cooling.
The psychological $120 region represents the next obvious zone traders may monitor if the rally continues.
These are technical reference areas rather than guaranteed turning points.
Bullish Scenario for the Crypto Market
The bullish scenario requires continued follow-through.
Bitcoin remains above $80,000 and eventually establishes sustainable trading above $85,000-$86,000.
U.S. spot Bitcoin ETF inflows remain positive.
Ethereum ETF flows improve.
ETH breaks through $2,800.
XRP holds its recent breakout.
Solana remains above the $110 region.
Bond yields avoid another sharp increase.
Oil prices remain under control.
Under those conditions, the current rebound could develop into a broader risk-on phase rather than a temporary short squeeze.
Neutral Scenario: Consolidation After the Rally
A consolidation would not automatically be bearish.
Bitcoin could spend time between approximately $80,000 and $86,000.
Ethereum might trade between $2,550 and $2,800.
XRP and SOL could retrace part of their latest gains while maintaining higher lows.
This type of market would allow leverage to reset.
It would also give investors more time to evaluate whether ETF inflows and institutional demand are sustainable.
After a rapid rebound, sideways consolidation can sometimes create a stronger base than another immediate vertical move.
Bearish Scenario: Fed Pressure Returns
The main bearish scenario involves renewed macroeconomic pressure.
If inflation concerns rise again, bond yields could increase and markets could begin pricing additional Federal Reserve tightening more aggressively.
Bitcoin could then fall back below $80,000.
Ethereum could lose $2,600.
XRP and Solana could experience proportionally larger corrections.
Renewed ETF outflows would strengthen the bearish case.
The biggest warning would not be one red trading day.
It would be simultaneous deterioration across price, institutional flows, macro liquidity and market breadth.
Why Traders Should Not Chase the Rally Blindly
The current market move is powerful.
But more than $648 million in short positions were liquidated over 24 hours in the data cited by The Block.
That means part of the buying pressure was forced rather than discretionary.
Once a short squeeze ends, price can consolidate or retrace.
Investors should therefore distinguish between momentum and sustainable demand.
Useful confirmation signals include continued ETF inflows, strong spot volume, successful resistance retests and healthy on-chain activity.
What to Watch Next in the Crypto Market
The next several sessions could determine whether the recovery has real staying power.
The first indicator is Bitcoin around $85,000-$86,000.
The second is spot Bitcoin ETF flows following the September 17-18 reversal.
The third is Ethereum ETF activity, which remains significantly less convincing.
The fourth is Treasury yields and Fed expectations.
The fifth is oil prices, particularly if renewed geopolitical pressure causes energy prices to rise again.
The sixth is market breadth: whether ETH, XRP, SOL and other altcoins continue strengthening without Bitcoin weakening materially.
And finally, regulatory developments will remain relevant as the SEC begins implementing its new tokenized-securities framework.
Why is the crypto market up today?
The September 21 rally appears to reflect several factors, including Bitcoin’s breakout, hundreds of millions of dollars in short liquidations, renewed Bitcoin ETF inflows, lower oil prices, easing Treasury yields and improving broader risk appetite.
What did the Federal Reserve do on September 16?
The Federal Reserve raised the federal-funds target range by 25 basis points to 3.75%-4.00% on September 16, 2026, saying inflation remained elevated despite solid economic activity.
What is Bitcoin trading at today?
Bitcoin briefly moved above $85,000 on September 21, although live prices vary continuously between exchanges and data providers.
What is Ethereum trading at today?
The Block reported Ethereum around $2,717 during the September 21 rally, up about 5.6% over 24 hours in its market snapshot.
Why is XRP rising?
XRP has benefited from the broader crypto-market rebound and improving altcoin risk appetite. The Block showed XRP around $1.49, up roughly 7.8%, while another current market analysis found no single dominant XRP-specific catalyst.
Why is Solana rising?
SOL is participating strongly in the broader recovery. Its price has rebounded from below $100 in mid-September to above $115, while Solana’s on-chain ecosystem continues to show significant DEX volume and active-address activity.
Are Bitcoin ETF inflows positive again?
Yes, in Farside’s latest completed data. Bitcoin ETFs recorded approximately $159.5 million of net inflows on September 17 and $324.6 million on September 18 following heavy withdrawals on September 15 and 16.
Are Ethereum ETF inflows positive?
The latest completed session was positive, with approximately $29.4 million of inflows on September 18. However, that followed three consecutive sessions of substantial net outflows.
Is the Fed rate hike bearish for crypto?
Higher interest rates can create pressure by tightening financial conditions and making safer yield-producing assets more attractive. However, crypto prices can still rise when other drivers—such as ETF demand, short covering or improving market sentiment—are stronger.
Is the current crypto recovery guaranteed to continue?
No. Bitcoin, Ethereum, XRP and Solana remain highly volatile. Continued recovery depends on factors including ETF flows, leverage, Fed expectations, oil and bond markets, technical support levels and broader investor sentiment.
Internal Link Suggestions for IBTC247
Bitcoin Price Today: BTC Holds Above $80K as ETF Inflows Return — Link from the Bitcoin and ETF sections.
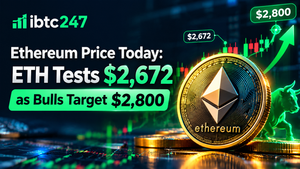
Ethereum Price Today: ETH Tests $2,672 as Bulls Target $2,800 — Link from the Ethereum market section.
Ethereum Price Prediction 2026: Can ETH Break $3,000 After the Latest Rally? — Link when discussing Ethereum’s next major psychological target.
Bitcoin Price Prediction September 2026: Can BTC Break $83K Next? — Link from the Bitcoin technical-analysis discussion.
Crypto Trading Guide: Support, Resistance and Breakouts — Link from the market-structure sections to help newer readers understand technical levels.
Tags
Crypto Market Today, Bitcoin, Ethereum, XRP, Solana, BTC Price, ETH Price, Fed Rate Hike, Bitcoin ETF, Ethereum ETF, Altcoins, Crypto News
Featured Image Recommendation
Featured Image Text:
CRYPTO MARKET REBOUNDS
BTC • ETH • XRP • SOL
Featured Image Alt Text:
Crypto market today showing Bitcoin, Ethereum, XRP and Solana recovering after the Federal Reserve’s September 2026 interest-rate hike.
Conclusion Crypto Has Recovered From the Fed Shock, but the Next Test Is Follow-Through
The cryptocurrency market has responded to the Federal Reserve’s September rate hike with considerably more strength than many traders might have expected.
The Fed increased its target range to 3.75%-4.00% on September 16, maintaining a restrictive policy stance because inflation remains elevated.
Initially, cryptocurrency prices struggled.
Bitcoin closed near $76,147 on September 16, Ethereum was around $2,416, XRP traded near $1.30 and Solana was below $100.
Only several days later, the picture looks very different.
Bitcoin briefly crossed $85,000. Ethereum reached approximately $2,717. XRP climbed to around $1.49, while Solana moved to approximately $115.75.
The total crypto market has returned to roughly $2.9 trillion, according to CoinGecko.
Several forces helped create the rebound.
Bitcoin ETF demand returned after heavy withdrawals. More than $750 million in leveraged crypto positions were liquidated, most of them shorts. Oil prices eased, Treasury yields declined, traditional equity sentiment improved, and recent SEC action on tokenized securities provided an additional constructive regulatory signal.
But the rally still needs confirmation.
Bitcoin must prove it can hold its recovery around the low-to-mid $80,000s.
Ethereum needs to establish sustainable strength above $2,700 and eventually challenge $2,800.
XRP needs to show that its sharp outperformance can survive beyond a broad market risk-on session.
Solana needs to maintain its breakout after one of the strongest recoveries among major cryptocurrencies.
Most importantly, traders should watch whether the next stage of the move is driven by real spot demand rather than additional forced short covering.
ETF flows will be critical.
Bitcoin’s institutional picture has improved noticeably, while Ethereum’s remains mixed. Farside’s next several daily readings may therefore help determine whether traditional-market capital is genuinely returning to crypto or whether the current move remains primarily momentum-driven.
The macro picture also remains uncertain.
The Federal Reserve has not declared victory over inflation, and markets still see a meaningful possibility of further tightening. Another rise in yields or energy prices could quickly challenge risk appetite.
For IBTC247 readers, the most important signals now are straightforward: Bitcoin’s ability to remain above $80,000-$83,000, BTC’s attempt to clear the $85,000-$86,000 region, Ethereum’s behavior around $2,700-$2,800, continued strength in XRP and Solana, and whether spot ETF inflows continue.


